Science
Glucose Ketone Index (GKI) Explained: What Your Meter Numbers Mean
If you own a blood ketone meter, you have seen three numbers: glucose, ketones, and a third one labelled GKI that the app highlights in a colour. Most people watch the colour and ignore the number. This guide explains what it actually measures, what the ranges mean, and what a real 72-hour water fast looks like when you track it.
The short answer
GKI = glucose (mmol/L) ÷ ketones (mmol/L). One number that says how much your body is running on fat versus sugar. Lower is deeper.
The zones: above 9 - not really in ketosis. 3-9 - nutritional ketosis, where keto dieters live. 1-3 - therapeutic ketosis, where a 72-hour fast usually ends up by day two. Below 1 - the deepest end, common on day three.
Glucose going up mid-fast is normal. Your liver makes it. Watch the ketone trend and the GKI, not the glucose number alone.
What GKI measures and how to calculate it
Your blood always carries both fuels: glucose (sugar) and ketones (made from fat). On a normal eating day, glucose is high and ketones are barely there. As a fast goes on, glucose drifts down and ketones climb. The Glucose Ketone Index simply puts the two on one scale by dividing one by the other, so a single number tells you which fuel is winning.
The formula needs both values in the same unit, mmol/L. Ketone meters already report blood ketones (beta-hydroxybutyrate, BHB) in mmol/L. Glucose is the catch: in the US and much of the world it is shown in mg/dL, and you divide that by 18 to get mmol/L. Then divide glucose by ketones.
Example: glucose 80 mg/dL, ketones 4.1 mmol/L.
80 ÷ 18 = 4.4 mmol/L glucose
4.4 ÷ 4.1 = GKI 1.1
The index was proposed by cancer researcher Thomas Seyfried's group in 2015 as a way to give patients on metabolic therapy one target to track instead of two. It has since become the standard readout on consumer meters, because it works just as well for a healthy person on a fast: it strips out day-to-day noise in either number and shows the trend.
The zones, from fed to therapeutic
The bands below are the ones most meters and clinicians use. They come from the Seyfried group's paper and have been slightly simplified by every app since; exact cut-offs vary by a point here or there.
| GKI | Zone | Where you see it |
|---|---|---|
| Above 9 | Not in ketosis | Normal eating days; the first 12-16 hours of a fast |
| 6-9 | Low ketosis | Late day one of a fast; a loose keto diet |
| 3-6 | Moderate / nutritional ketosis | A strict keto diet; roughly hour 20-30 of a water fast |
| 1-3 | High / therapeutic ketosis | Day two onwards of a water fast |
| Below 1 | Deepest therapeutic range | Day three of a water fast; the target in some clinical protocols |
Two things worth noticing. First, the scale is not linear - the gap between 9 and 3 is the difference between "barely fasting" and "clearly fasting", while the gap between 1.5 and 0.9 is barely worth mentioning. Second, there is no prize at the bottom. A GKI of 1.1 versus 0.9 tells you nothing useful about a healthy person on a 3-day fast; both mean you are deep in and doing it right.
A real 72-hour fast, measured
These are actual finger-prick readings from one of us, taken with a consumer glucose-and-ketone meter during a water fast with electrolytes only. One fast, one person - a real example, not a study - but the shape is the shape almost everyone sees.
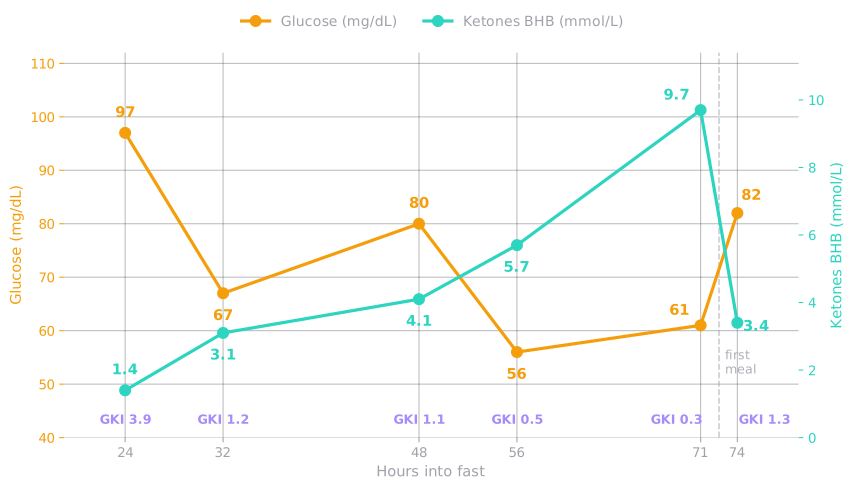
| Hour | Glucose mg/dL | Ketones mmol/L | GKI | Notes |
|---|---|---|---|---|
| ~24 | 97 | 1.4 | 3.9 | Ketosis started, glucose still at a normal fed-day baseline |
| 32 | 67 | 3.1 | 1.2 | Meter flagged the low glucose - felt fine, ketones now well up |
| 48 | 80 | 4.1 | 1.1 | Glucose came back UP - liver making its own - ketones still rising |
| 56 | 56 | 5.7 | 0.5 | Below 1 - deepest zone on the scale, entering day three |
| 71 | 61 | 9.7 | 0.3 | Peak ketones - end of the fast, time to eat |
| 74 (2h after first meal) | 82 | 3.4 | 1.3 | Broth, collagen, avocado, eggs, kraut - no carbs, so no glucose spike; ketones already halved |
Read across the rows and three things stand out. Ketones climb steadily and never stop until you eat: 1.4, 3.1, 4.1, 5.7, 9.7 by the end, then halved within two hours of the first meal. Glucose does not fall in a straight line: it drops, comes back up, drops again, and settles around 60. And GKI does most of its moving in the first day and a half, then settles around 1 and drifts below it on day three - which is exactly what the zone table predicts.
The refeed row is worth a look too. Two hours after breaking the fast with broth, collagen, avocado, eggs and a little sauerkraut, glucose was 82 - essentially no spike, because there were no carbs to spike on. That is the practical case for a low-carb first meal: the temporary post-fast insulin resistance never gets a chance to show up. Ketones, on the other hand, react immediately - protein and the return of insulin turn production down within hours, and GKI climbed from 0.3 back to 1.3.
The meter itself threw a low-glucose warning at the hour-32 reading. That is the device doing its job for a diabetic user, not a verdict on the fast. A glucose of 67 with ketones at 3.1 and no symptoms is a fasting body doing what it should - the brain is being fed by ketones. The signals that would actually mean "stop" are shakiness, confusion, a racing heart or feeling faint, and they are covered in the safety guide.
Why glucose goes back up mid-fast
This is the reading that confuses people most. Glucose was 67 at hour 32 and 80 at hour 48 - up, not down, with no food. Did the fast break itself?
No. Your body does not let glucose fall towards zero, because a few tissues - red blood cells, parts of the kidney, a fraction of the brain - can only run on it. So the liver manufactures new glucose throughout a fast, a process called gluconeogenesis. The raw materials are glycerol, which is released every time a fat molecule is broken down for fuel, plus lactate and a small amount of amino acid. The more fat you burn, the more glycerol you free up, and the more glucose the liver can make from it. Deep in ketosis, glucose production is fed by fat burning itself.
This is why glucose on a long fast tends to settle somewhere in the 60s-80s and wobble around rather than keep sliding. It also means a single glucose reading tells you very little about how the fast is going. The ketone number and the GKI carry the information: if ketones are still rising, the fast is intact, whatever glucose did in the last few hours.
What about the muscle?
Some of the amino acid the liver uses does come from protein turnover, and that is the kernel of truth in the "fasting eats muscle" worry. In practice the amount is small and falls as ketones rise, because ketones directly reduce how much protein the body needs to break down. The full picture, with the numbers, is in the muscle-loss guide.
What therapeutic ketosis actually means
The phrase sounds like a promise, so it is worth being precise. "Therapeutic ketosis" is a label from clinical research for the deeper end of ketosis - blood ketones above roughly 3 mmol/L, GKI under 3 and ideally near 1. It comes from the medical uses of ketogenic diets: originally drug-resistant epilepsy in children, where the ketogenic diet has been used for a century, and more recently research into cancer metabolism, some brain conditions and metabolic disease.
In that research the GKI is used as a target because it tracks the thing the therapy is trying to achieve: low glucose availability alongside high ketone availability. Seyfried's group suggested a GKI of 1 or below as the aim for cancer patients on metabolic therapy. That is where the "GKI under 1" goal that floats around fasting forums comes from.
For a healthy person doing a 3-day fast, the honest reading is this: reaching the therapeutic range is normal, expected, and safe. It confirms you are as deep in as a water fast gets. It does not mean a specific therapeutic effect is happening in your body - those claims are being studied in patients, under supervision, on protocols that last weeks. The label describes the state, not a guaranteed outcome.
What is well supported for the general fasting population is covered in the benefits guide and the autophagy guide. Deep ketosis is the state in which those processes are running hardest.
Ketosis is not ketoacidosis
Because both words start with "keto", a reading of 4 or 5 mmol/L makes some people nervous. The distinction is simple and important.
Ketosis, the state a fast produces, is regulated. Insulin is low but present, and it keeps ketone production in a band - typically 3-6 mmol/L at the deep end of a water fast, and by the end of day three some people go past 9. Glucose is low or normal. Blood pH stays normal.
Diabetic ketoacidosis is unregulated. It happens when there is no insulin at all - essentially type 1 diabetes, or advanced type 2 in specific circumstances. Without insulin, ketones climb past 10 mmol/L with no brake, and, crucially, glucose is high at the same time, often above 250 mg/dL, because nothing is moving it into cells. Blood becomes acidic. It is a medical emergency.
So the pattern a fast produces - rising ketones, low or normal glucose - is by definition not ketoacidosis. If you have type 1 diabetes, extended fasting needs a doctor involved before you start; the meter alone is not enough. For everyone else, ketones of 4 with glucose of 80 is a fast going well.
Frequently asked questions
What is a good GKI during a water fast?
It depends on the day. On day one, anything under 9 means ketosis has started. By the end of day two, most people are between 1 and 3, which is the range researchers call therapeutic ketosis. Dipping below 1 on day three is common and is the deepest end of the scale. There is no prize for a lower number - a GKI of 1.1 versus 0.9 is not a meaningful difference for a healthy person on a 72-hour fast.
How do I calculate GKI from mg/dL?
Convert glucose to mmol/L first by dividing by 18, then divide by your blood ketone (BHB) reading. So glucose 80 mg/dL becomes 4.4 mmol/L; with ketones at 4.1 mmol/L, GKI is 4.4 divided by 4.1, or about 1.1. If your meter shows glucose in mmol/L already, skip the first step. Most modern ketone meters and their apps calculate it for you.
Why did my glucose go up while fasting?
Because your liver made it. Glucose does not just fall towards zero on a fast - the liver produces new glucose from glycerol (released as fat is broken down) and from a small amount of protein, and it does this in waves. A reading of 67 at hour 32 and 80 at hour 48 is a normal pattern, not a sign that anything went wrong or that you accidentally ate something. What matters is that ketones keep rising alongside it.
What is therapeutic ketosis?
A term from clinical research - originally epilepsy, more recently cancer, brain conditions and metabolic disease - for the deeper end of ketosis: blood ketones above about 3 mmol/L and a GKI under 3, ideally near 1. Some cancer-metabolism protocols target a GKI of 1 or below. For a healthy person doing a 3-day fast, reaching it is normal and safe; the label just means very deep ketosis, not that a specific therapeutic effect is guaranteed.
Is a high ketone reading dangerous?
Not in the ranges a water fast produces. Blood ketones of 3-6 mmol/L on day two or three are expected. The dangerous state is diabetic ketoacidosis, which is a completely different thing: ketones typically above 10 mmol/L together with high glucose, because there is no insulin to keep either in check. It essentially only happens in type 1 diabetes or advanced type 2. High ketones with low or normal glucose - what a fast produces - is not ketoacidosis.
Do I need to measure GKI at all?
No. Millions of people fast without ever pricking a finger and it works exactly the same. Measuring is for the curious, and it does answer a few real questions - whether you are actually in ketosis, how deep, and whether a bit of cream in your coffee is holding you back. If you do measure, once or twice a day is plenty; the numbers change slowly.
References
The key studies behind the claims on this page.
The glucose ketone index calculator: a simple tool to monitor therapeutic efficacy for metabolic management of brain cancer
Meidenbauer JJ, Mukherjee P, Seyfried TN - Nutrition & Metabolism
The paper that defined the GKI, its formula and the target ranges used in metabolic therapy. Source of the zone cut-offs and the "GKI of 1 or below" therapeutic target discussed on this page.
View studyFuel metabolism in starvation
Cahill GF Jr - Annual Review of Nutrition
The classic review of how the body switches fuels across a fast: gluconeogenesis from glycerol and amino acids, why glucose is defended rather than falling to zero, and how rising ketones spare protein. The basis for the mid-fast glucose section.
View studyMedical disclaimer: this article is for information only and is not medical advice. If you have type 1 diabetes, take insulin or other glucose-lowering medication, or have any condition affecting blood sugar, do not attempt an extended fast without your doctor's involvement. Home meters can be off by 10-15%; they are for trends, not diagnosis.
Know what phase you are in, with or without a meter
Our app shows the ketosis and autophagy phases of a 72-hour fast in real time, with a journal for your own readings.
Get the App - FreeAvailable on iOS & Android.